


POSITION
WORKSPACE
Most operations in Position happen in the workspace, which is the currently loaded dataset of points. These can be loaded from files or from database queries. Data from files and queries can be concatenated so that several files and/or queries can be mixed together. Several file types, of both raw and processed data can be read. Queries on the data stored in the database can be constructed from various parameters and used to retrieve custom datasets, and these queries can be named and stored for repeated use. Once the workspace is loaded with data, it can be viewed, edited, QC’d and exported in various formats. The data can be viewed in the table, horizontal plot and vertical profile and can be edited in the table view.
TABLE VIEW
The main display in the table view is a customisable spreadsheet that can display up to 82 configurable columns of position, point type, calculated and QC data. It also has a small side table which displays error and warning counts for all configured tolerances. Below that is a summary table for water and airgun information. Below this again are receiver and source summary clip buttons, which load summary information to the operating system clipboard for inclusion in daily reports. At the bottom of the view is a status bar which contains loading progress, total number of records loaded in the workspace, the last stored dataset input source, the last exported file with a dropdown history, and a total number of selected points.
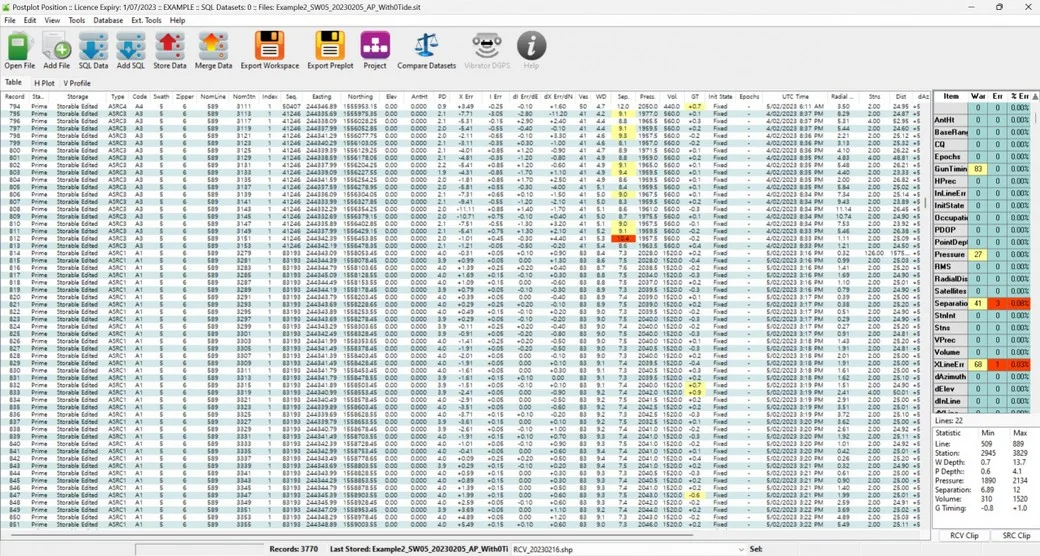
The image above shows a typical table view of some newly processed airgun positions. The specifications set by the user indicate that 3 shots had array separation and 1 cross line position outside of tolerance. These are highlighted on each cell of the table where they occur as well as being summarised at the right to draw attention to any that are scrolled out of sight.
One of Position’s features is to automatically recognise and lookup check stations. These are often used during RTK set out, to confirm base station setup and antenna height settings against previously set out points.
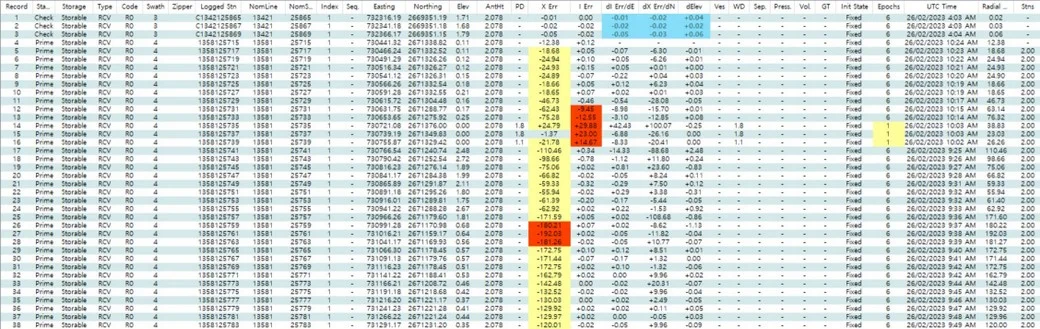
In the image above, the first three lines are check points distinguished by the “c” prefix in the logged station name and the blue highlighting in the dl Err, dX Err and dElev columns. When Position detects check points, it searches the current file then the database for matches. If found, the comparisons are shown as above. If the comparisons are outside the set tolerance, the values would be displayed red. This check not only shows the results of check points, but also assures compliance with positioning specifications.
The tolerances for many different measurements can be set individually for each defined point type and each measurement. These measurements can be for positions, recorded QC data, calculated values (including changes from one point to the next in line) or any other value that can be displayed. For points in water, tolerances can be varied based on different ranges of water depth.
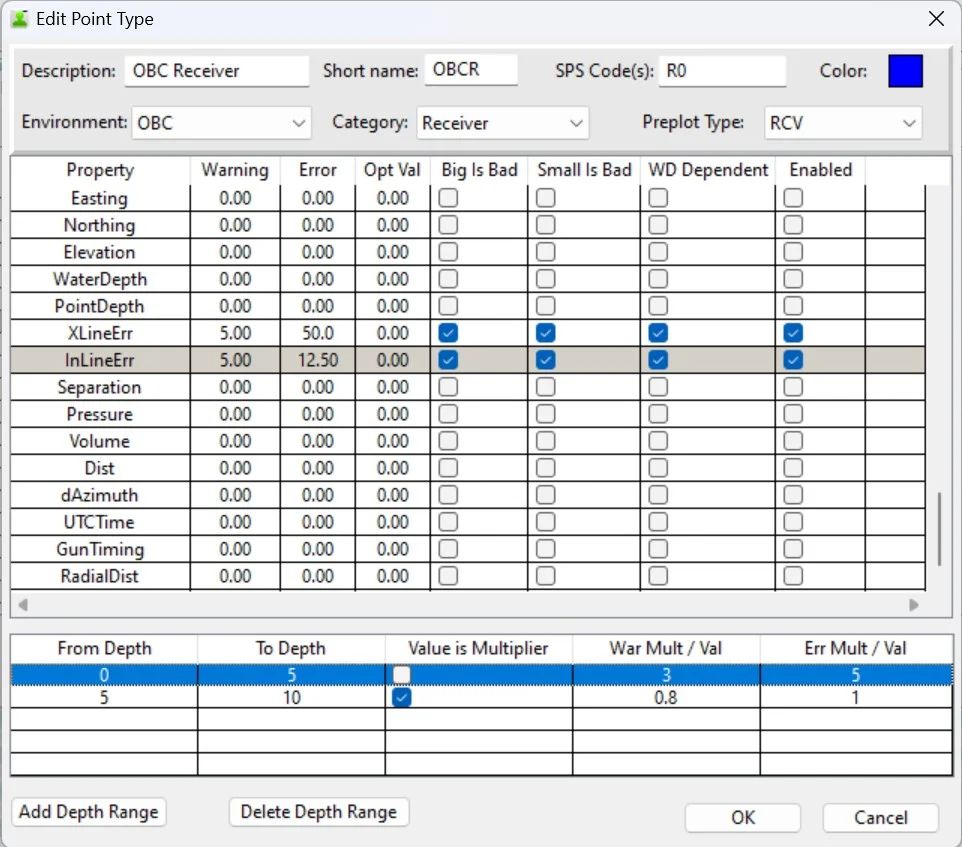
The image above shows a point type setup that includes variable crossline and inline tolerances in different water depths.
HORIZONTAL PLOT VIEW
The horizontal plot displays the workspace graphically in plan view. The view can be zoomed and panned. Preplot positions and/or station numbers can be displayed. The point size can be varied. The points can be colour coded by error level, day of acquisition, line number, swath number, point type, point index or data source (if multiple files are concatenated). Hovering over a point will display its line and station number. Right-clicking close to a point will display several values related to that point.
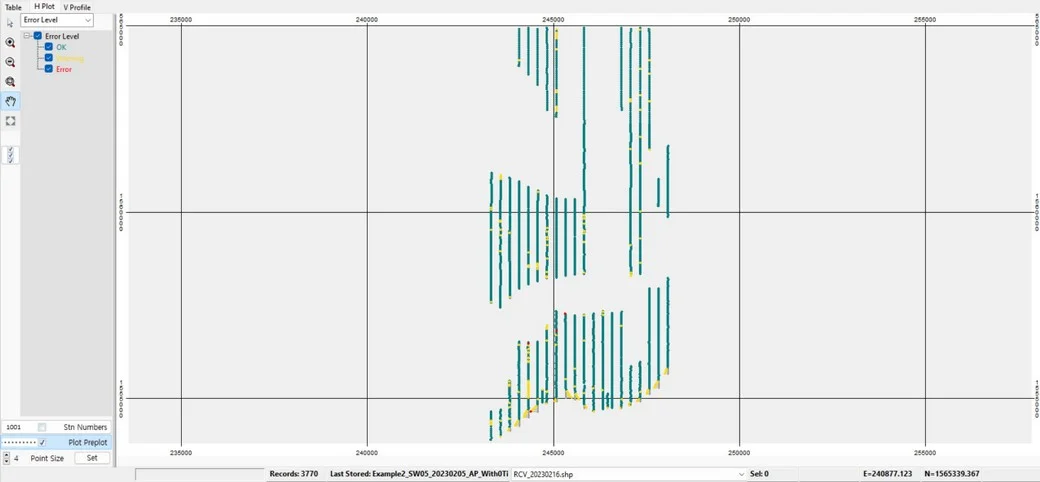
The image above shows the same air gun data as the earlier table view. It is colour coded by error level. Station numbering is disabled but preplots are enabled.
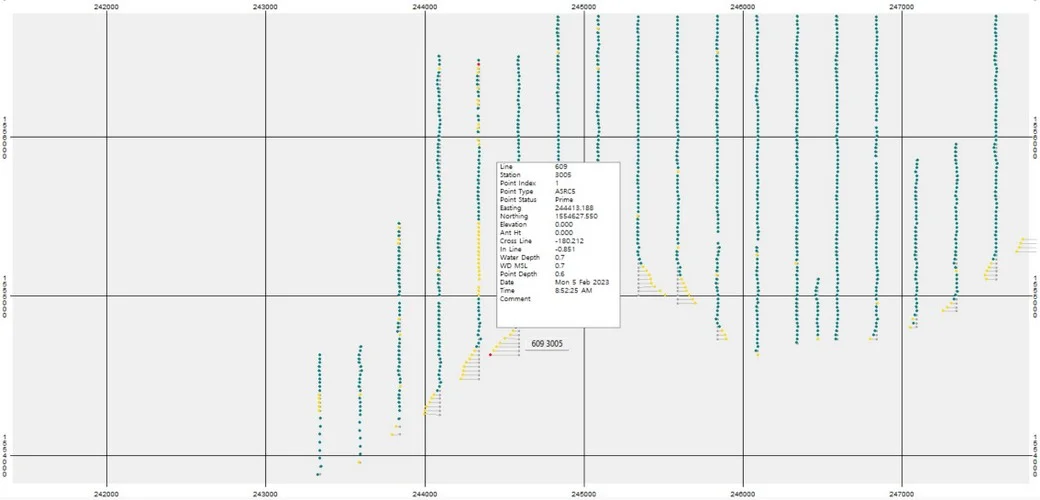
The image above shows the same airgun data zoomed to show more detail around the line ends where the gunboat has turned at the shore to allow more shots. The preplot positions can be seen in grey. The red point near the top is colour coded to indicate a large array separation. The one near the bottom is colour coded to indicate that its crossline position has exceeded normal allowable tolerance for this point type. The point has been right clicked to display extra information about the point.
VERTICAL PROFILE VIEW
The vertical profile displays a side on view of the data looking across the lines with the low station numbers to the left and high numbers to the right. The same colour coding options as the horizontal plot apply to the vertical profile. As well as the point elevations, the bottom elevation, surface elevation, external tide values and external bathymetry can be displayed. The image can be zoomed and panned. However, the zooming can be performed either vertically or horizontally as required.
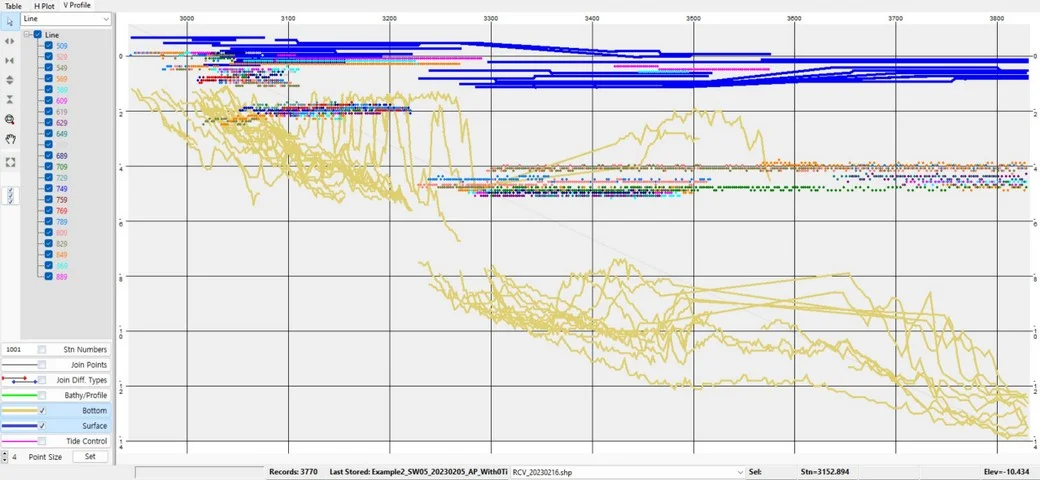
The image above shows the same airgun data in vertical profile colour coded by line number. This view can become somewhat crowded when looking across many lines, as can be seen. However, any layer (line in this case) can be turned off at left. For instance, at the top left some very shallow airgun shots (multi coloured) appear to be above the water level (blue), however these are from different lines and therefore different times and depths. This profile plot helps in detecting grossly wrong measurements such as false echo sounder readings that have passed through filtering.
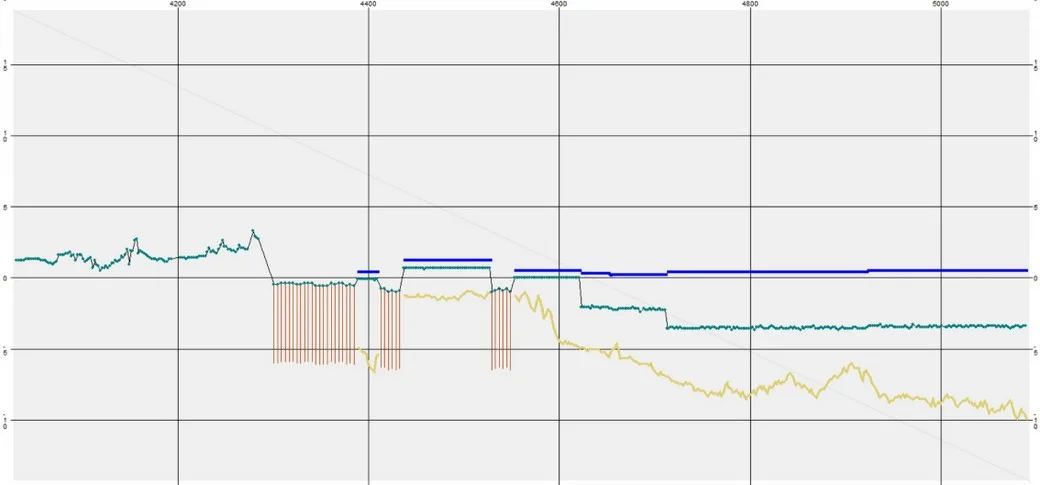
The image above shows a vertical profile isolated to a single line with vibrator points on land to the left above MSL. The point types then alternate between very shallow airgun and TZ shot hole as the line crosses a channel and a lagoon, then moves into open water. The shot holes can be seen with their loaded depths displayed in brown. The shallow airguns can be seen with the green airgun points just below the blue water level. To the right, the yellow line shows the water depth increasing into open water. As the increasing water depth allows, the gun depth (blue to green difference) steps up to the maximum.
One of the most used features in Position is the Compare Datasets function. Datasets from external files or selections from the database can be compared using various parameters, and the results exported to a csv file. Either all records or just those with detected differences can be exported.
This feature can be used on a daily basis to compare the output from external re-processing routines to contractor supplied values, or with final data, to compare final SPS or SIT/RIT files to datasets generated from the database.
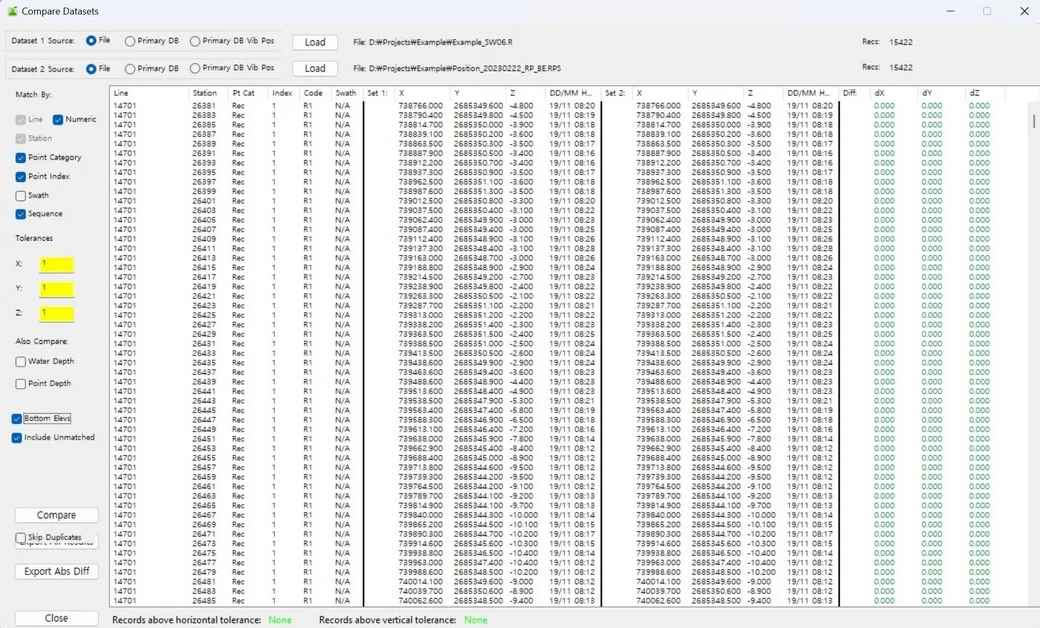
In the dataset comparison above a final RPS file is compared to a file extracted from daily data accumulated in the database. The two green None’s at the bottom indicate that no further investigation is necessary. If there is, the results can be exported to a csv file and manipulated in a spreadsheet program to isolate any discrepancies.
INTERSECTION REPORT
A good final test to run on a data shipment is an intersection report. Position scans a dataset and determines every line crossing. Once it detects a crossing, it calculates the station position on each line then uses these to interpolate an elevation at the intersection for each line. If there is perfectly even slope in both directions, these values should agree. If they disagree, either there is some surface irregularity affecting the interpolation, or there is a local error that wasn’t previously detected.
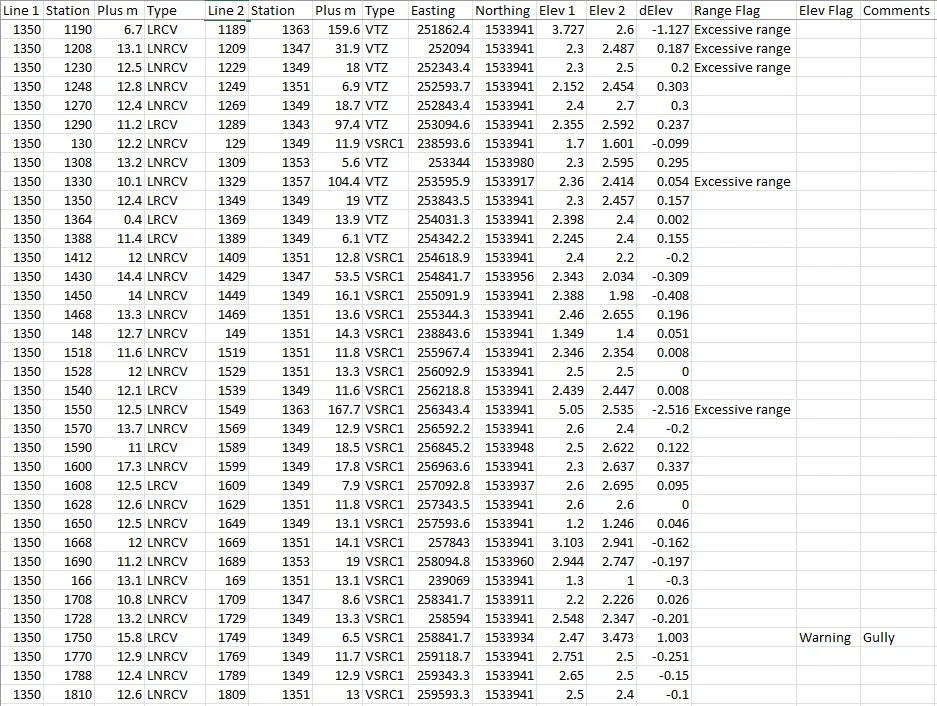
In the image above, a section of intersection report is shown where the elevation mismatch tolerance has been set at 1m. The intersection range tolerance has been set at 100m. This Range Flag indicates that one of the interpolation stations was too far from the intersection to give a reliable interpolation and should be disregarded. The warning on the fourth last line indicates a mismatch greater than the specified tolerance. This intersection was investigated in GIS against satellite imagery and a gully was seen to affect the elevation of one of the adjacent stations. The QC added the “Gully” comment to indicate that the mismatch was investigated.
OUPUT FILES
We use a number of external programs including Microsoft Excel (or Open Office Calc) and QGIS (or ArcMap) to help QC the data.
Workspace data can be exported in CSV format with various combinations of measured and calculated data for further sorting, filtering and manipulation, typically in Excel. Several other text file formats can be exported including SPS, SEGP1, P1/90, DXF, GPX and KML.
It can also be exported in Shapefile format for individual datasets to view in GIS software. It can also append to a number of CSV formats for cumulative data that can also be viewed in GIS software without adding new layers.
TOOLS
Position also has a number of auxiliary tools such as calculators and group displays, that can show workspace groupings by line, swath, point type, vessel etc.
STORAGE
As mentioned earlier, Position is able to store workspace data for accumulation and later retrieval. This can be used to create final data in production work or comparison datasets in QC work. Data can be retrieved using various parameters using the SQL Builder. The final SQL can also be hand edited for fine tuning of the query. Queries are stored for reuse.

A query can be seen above with the generic “RCV” point category replaced with the more specific “R1” SPS code and the date ranges removed.
When dealing with many different data sources, especially with ongoing deletions, moves and resurveys, there is a danger of ending up with duplicates in the database which are difficult sort later on. To prevent this, Position always scans the database for duplicates (based on configurable match parameters) whenever the user attempts to store data. If any duplicates are found they will be presented to the user with x, y and z differences and other information about the matches found. Storage is not allowed to proceed until the user decides what action to take with the duplicate records. The choices are to replace, increase the index by 1, change the point status to a check station, skip and don’t store or store the duplicate (not recommended).
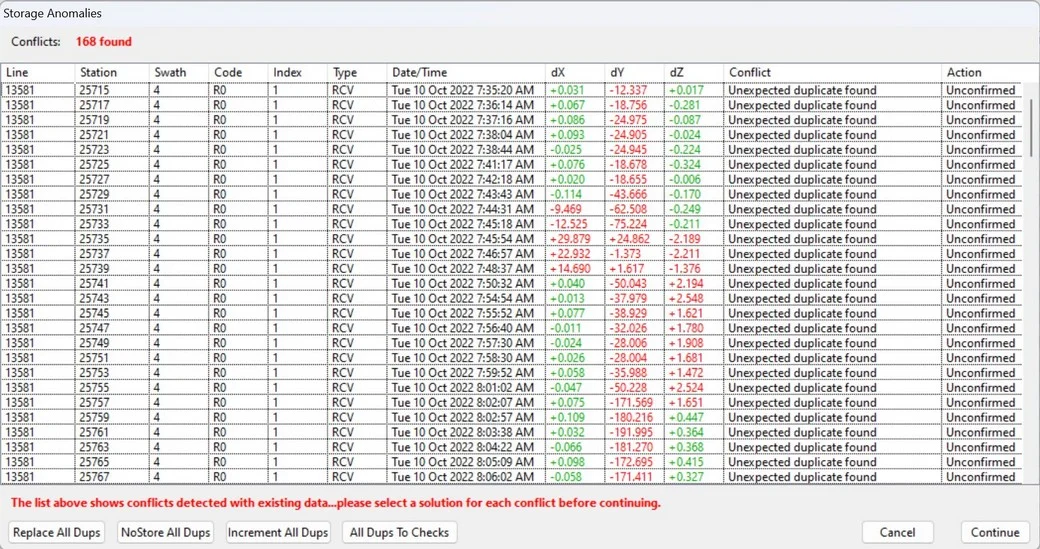
In the image above, 168 duplicates were detected. These were actually moved and resurveyed, so in this case the Replace All Dups button will be clicked. That will change the selection of the Action column to “Replace” for all records. These will allow the storage to proceed. If any records have an Action of Unconfirmed, storage will be disallowed. Records can have their actions individually set if necessary, by clicking in the relevant action cell which will present a drop-down menu.
FUTURE
Position has its roots in DOS based software the author created in the early 1990’s to have the ability to immediately display and highlight common errors when the data was loaded. It was rewritten beginning in 2007 with larger memory available and easier production of graphics. That same code base is still running today with many additions and alterations. In fact there have been so many alterations that it is overdue for a complete overhaul.
That has just begun. The new version will be written in a more up-to-date programming language. Storage will be in a spatial database to allow integration with GIS software. This will probably be PostGIS to allow access on a NAS drive and easier later migration to cloud based storage. Spatialite would be another choice, but it is really limited to single PC deployment.
Graphic displays will be redesigned for better performance. Open source libraries will be used for geodetic transformations and computations, rather than the internal routines the author has previously developed. Data loading performance will be enhanced by refactoring QC calculations and handing them off to multiple processing cores which are available on all new PCs. Preplot handling will be redesigned to offer more flexibility and better performance.
Applications such as DepthCheck and Fold will be integrated to allow shared use of many routines, especially file, transformation, licensing, and specialised geometric routines. Gundog may be integrated as well for the same reasons.
In the near future, Position (perhaps with a different name), will be an even more powerful and comprehensive seismic positioning QC tool for land, TZ and shallow water surveys.