


GUNDOG
For the seismic positioning QC, and the OBC/OBN contractor, a reliable rapid check of all gunboat and acoustic processing sequences after processing is essential to ensure correct processing. For this purpose, Gundog is the most efficient and thorough solution.
The programme reads all the raw instrument inputs from P2 files, Kalman filters all measurements to generates accurate positions of all vessel nodes and gun string locations. Using positions not available in real time from the navigation system, it allows accurate computation of shot point locations and acoustic positioning.
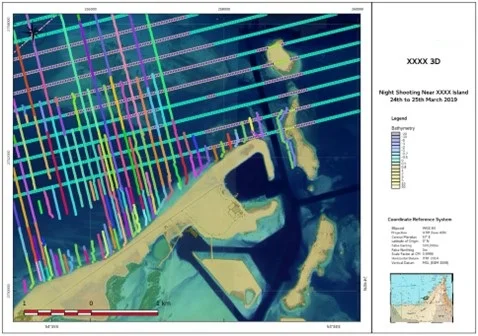
QC comparisons with the contractor supplied results and tests against contract specifications are immediately presented graphically and saved directly to a spatial database for viewing in any GIS package. These can then be used to present quality mapping in real time. Many QC issues, especially in busy oilfields and TZ operations, are related to obstacles and seabed restrictions which can be immediately seen during the QC process.
One main feature of the package is that once setup for the job, multiple vessels with many different configurations can be processed automatically and simultaneously in the same post processing session allowing the QC to be working on other important issues while the processing is ongoing. Processing times are far quicker than other packages as all manual steps needed are pre-set and automatic, allowing the QC to check what it has taken many hours for the contractor to process, in a few minutes.
Gundog can produce final data where required, in addition to QC tools to analyse gun statistics and quality indicators and acoustic positioning results rapidly and in depth, then compare results with contractor generated values. Displays are designed to give maximum information on important aspects rapidly, and to confirm compliance at a glance. In the event of discrepancies, information on failures is quick to analyse. Checked data checked are immediately available to other applications from the database.
Gundog is also not aimed at production reporting like MultiSeis and CheckPoint, but can be used to generate statistics to aid this process. Unlike some other packages, it is not simply taking the final data to produce summary statistics and simple plots, but to rigorously analyse the navigation systems and source information to quickly identify errors and root causes to facilitate their quick rectification.
As can be seen, Gundog is an extremely capable processor of shallow water source and receiver positions. Although it can be used for production post-processing, it is designed primarily as a QC tool. To this end it can produce a wealth of forensic detail about positioning solutions, allowing the QC to analyse any problems that it detects. All this can be achieved very quickly, so that large amounts of data can be analysed in minimal time without the risk of missing crucial.
CONFIGURATION
All settings and results are stored in a Spatialite database allowing all tables to be linked as layers into ArcMap or QGIS, thus allowing instant display of processed lines and visual QC of data.
Spatialite is a single file database, based on SQLite with spatial extensions, which allows easy portability so back-to-back QCs can swap the up-to-date project at handover with minimal fuss.
One of the primary goals of the software is to automatically process any files thrown at it. This necessarily means there is a certain amount of configuration required at the start of the project.
Defaults for all file types to be read and default location to open data files together with mapping system definition need to be defined. Also paths to all ancillary files relating to the P2 raw data (SPS, SBS, etc) are set so that the program automatically finds all files required to process the sequences.

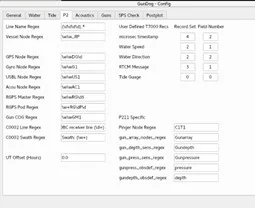
Currently two separate geotiff files of bathymetry data can be mapped to provide water depths for receivers and check echo sounder records for source vessels. Where not defined in the P2 file, velocity of sound in water measurements can be manually entered to provide acoustic corrections.
Vessel nodes can be defined explicitly (full name of each) or using wild cards to identify vessel reference points for multiple vessels from the pattern. Processing options and QC limits are also defined in the configuration.
Source and receiver preplots are loaded to the database for comparison QCs. The stored queries in the database calculate additional information to allow automatic labelling in ArcMap and QGIS.

SOURCE ANALYSIS
Source sequences can be processed individually or all at once from a single folder. Once the path to the P2s has been set all other required files are matched up and missing files highlighted.

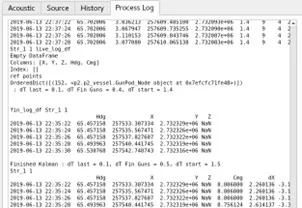
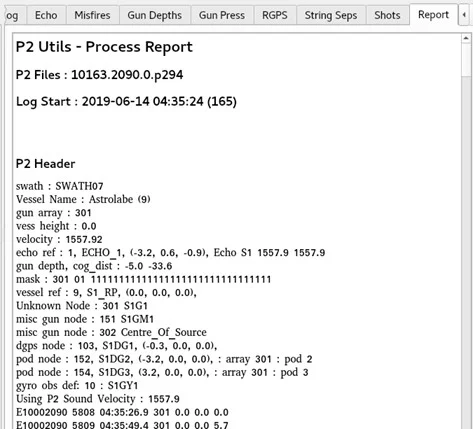
Processing is then a simple single button click. A text panel and progress bar show progress (that can be interrupted if required) and the most important calculations output a log in case something needs analysing at the raw data level.
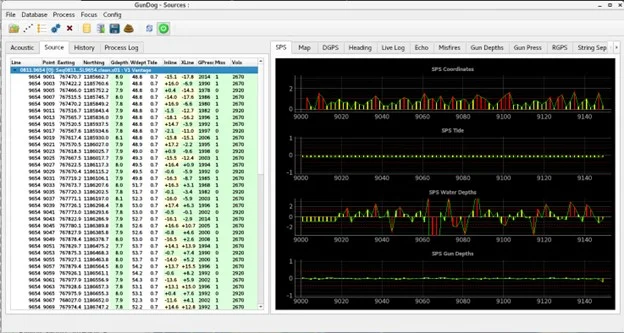
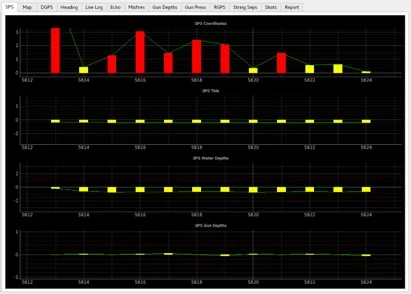
On completion all check results are available by tabbing through the displays. The primary check is against the final crew SPS / SIT and is the first to be displayed. Shot statistics are flagged where items are out of specification, and the graphs provide vivid plots showing differences from computed and crew SPS / SIT values. Differences can then be investigated on the appropriate tabs.
P1 files with computed positions for the main vessel reference, echo sounder, gun pod and Gun COG nodes and preplot-postplot files are automatically generated for each sequence. Also, a summary report of processing and QC checks together with a final SPS file can be saved.
SPS analysis quickly identifies bad processing in positions produced by other proprietary software, tide vs predicted tide table values are checked, water depths vs measured echo sounder values and gun depths are checked.
Bad tide data is similarly easily identified.

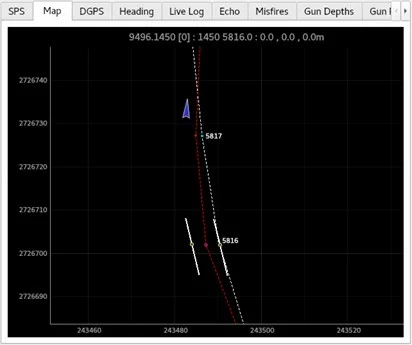
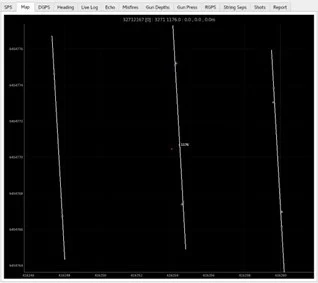
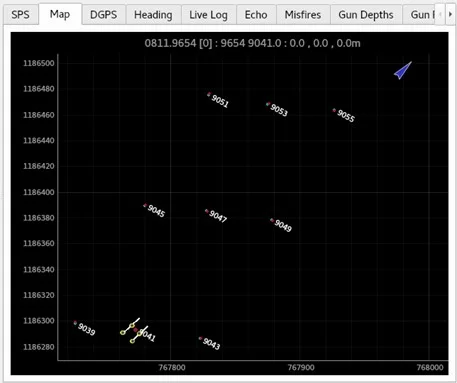
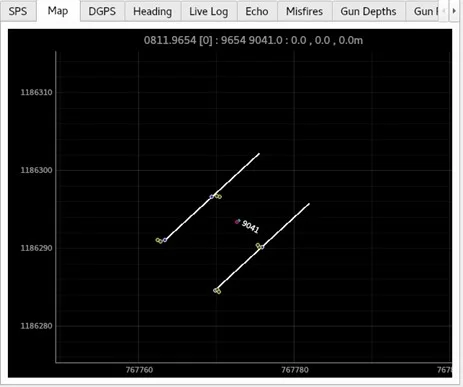
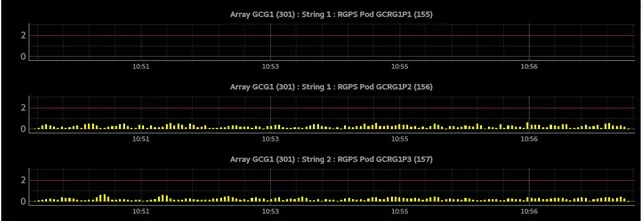
The map display is also handy to check for unusual RGPS errors as all pod positions are plotted over the calculated float positions.

The display can be zoomed to analyse RGPS vs pod positions vs corrected string positions.
Understanding of unusual situations (bad RGPS) and strong currents immediately become clear.
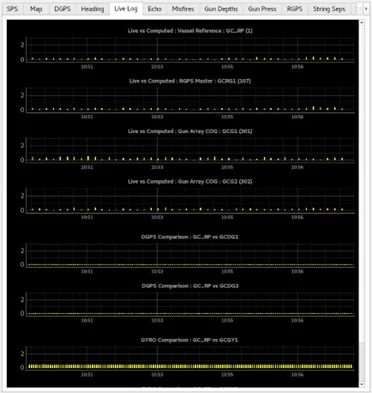
Heading and gyro comparisons are automatically presented to check instruments agree.

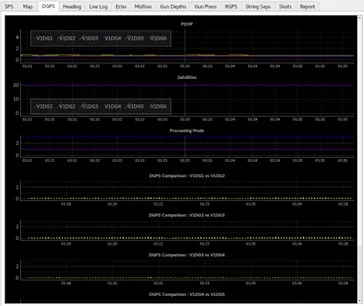
DGPS receiver status checks and comparisons between reference receivers are shown.
All charts can be zoomed and scaled for investigation and setting up as presentation quality plots for reports.
Live navigation system results are compared with computed values to aid identification of bad processing results.
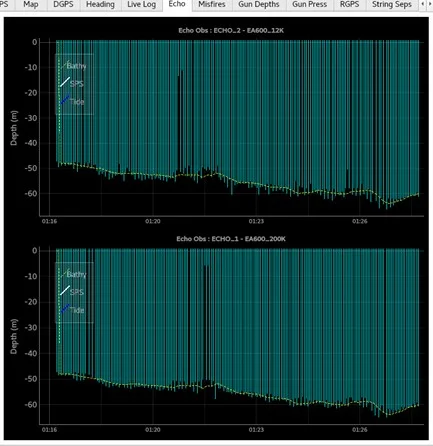
Example echo sounder displays easily show discrepancies with bathymetry and SPS data.
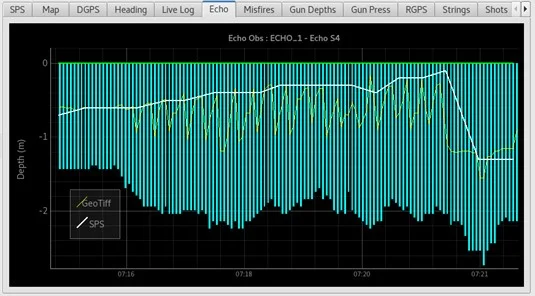
Multiple echo sounders are displayed together.
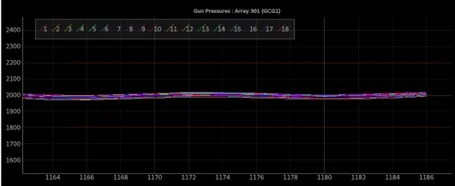
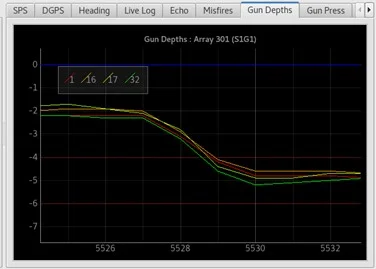
Gun depths and pressures are displayed with all sensors colour coded.
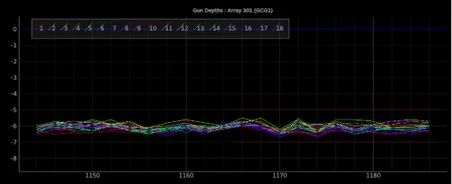
Gun depth errors are quickly identified and investigated.

Misfires and disabled guns are plotted with total fired volume and misfired guns identified and colour coded by volume for quick identification.

RGPS coordinates vs reprocessed values give quality indication of the RGPS system.
String separations are displayed in easy-to-read forms. These are accurately calculated (unlike most other proprietary solutions) by processing each float as a separate vessel with custom algorithms.

Shot point inline (D/A) and crossline (D/C) offsets are displayed in easy-to-understand formats.

ACOUSTIC PROCESSING
The acoustic positioning module of Gundog allows reprocessing of ranging systems and USBL. The process is again mostly automatic using least squares to generate quality positioning with automatic bad measurement elimination.
Preplots, drop points (from deployment vessel) and previously processed positions are stored in the database for comparison with the computed positions.
The vessel positioning is recomputed exactly as for source vessels and has most of the same equipment and positioning checks. However, the map display is then used as the primary acoustic process display.
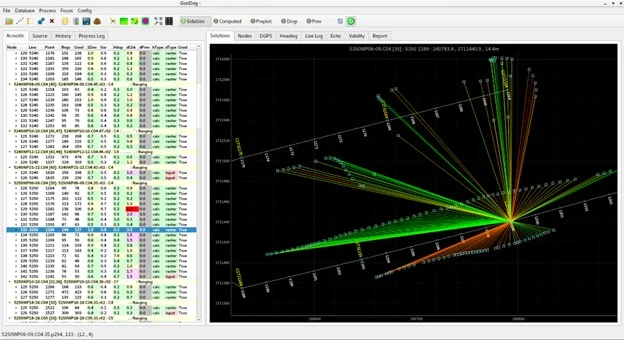
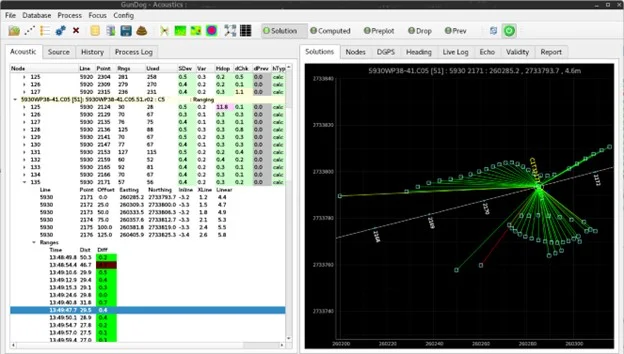
Options are present to focus on the contractor provided coordinates, the calculated coordinates or if desired dragged to wherever required. The agreement of ranges with the solution is immediately displayed and easily presents the QC with visual overall agreement of the solution. The selection display highlights immediately any major differences with crew computations.

Errors in positioning can be drilled down in the file selector from each P2 file, then each pinger location, then the stations between the pingers, and each measurement.
USBL processing is presented in the same way.
