FOLD
Fold only works with 3D projects for now but will probably be expanded to include 2D as the need arises. Fold has three functions.
Firstly, it can display a fold plot given receiver and source inputs either in RIT/SIT format or SPS. If no cross-reference file is supplied, offsets can be limited in various of ways to calculate theoretical fold.
Secondly, if a cross-reference file is supplied, source and receiver gathers can be displayed.
Finally, if a cross-reference (SPS-X) file is supplied, the validity of the file can be checked regarding references to receiver and source files.
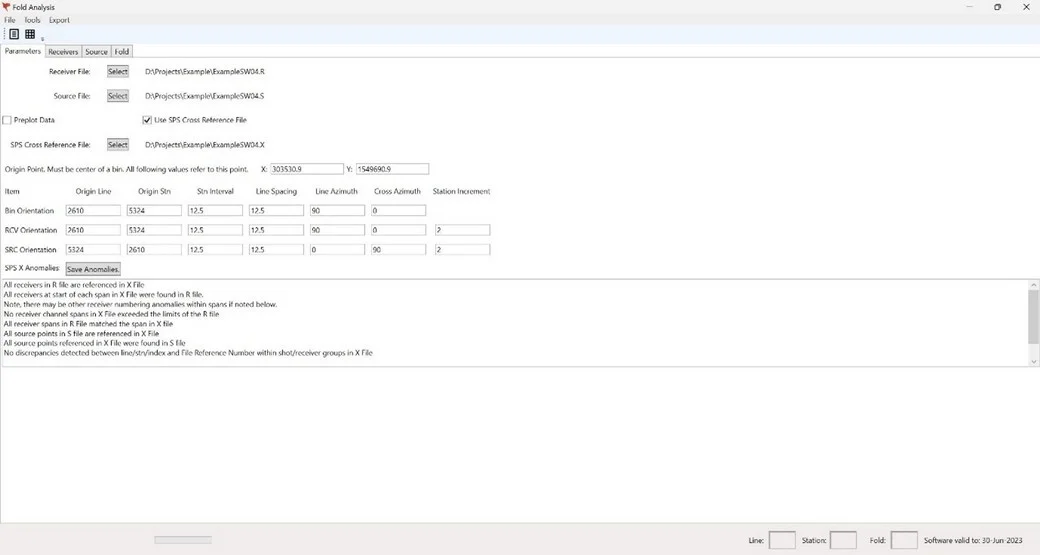
SETUP and VALIDITY TAB
This is the initialisation screen. Here the input files and geometry can be set up. All these parameters can be stored in a JSON file and retrieved in a future session to avoid re-entering figures.
The bin geometry usually follows the receiver geometry.
Files can either be RIT/SIT or SPS – S, R & X.
Once the file read button is clicked and the files are read, this screen will also display integrity checks (SPS X Anomalies) if an SPS X file is included. All the checks in the display below are performed to ensure integrity between the data in the X file and that in the R and S files. File Reference Numbers will not be checked if the Preplot Data option is checked.
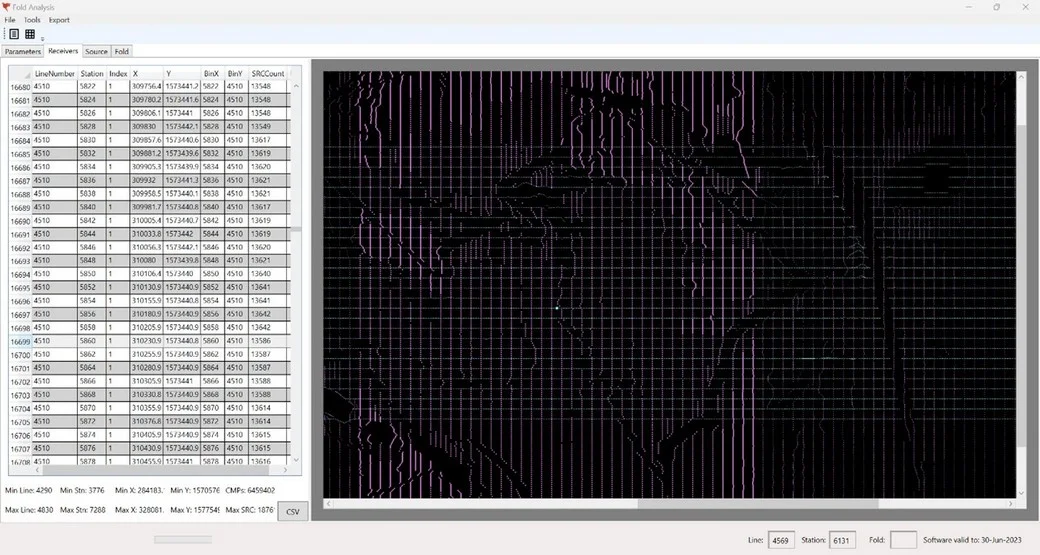
RECEIVER GATHER TAB
All receivers are listed here with their index, X & Y coordinates, and Bin coordinates.
If an X file is included, the source count for each receiver is also shown.
All receiver and source points are shown graphically to the right. The image can be zoomed in and out using the mouse wheel, and by zooming from different mouse positions, key areas can be focussed.
The gathers for a particular receiver can be shown as highlighted (in magenta) by either selecting the desired receiver from the table on the left, or by clicking on its position in the plot on the right. The selected receiver is highlighted in cyan. See below.
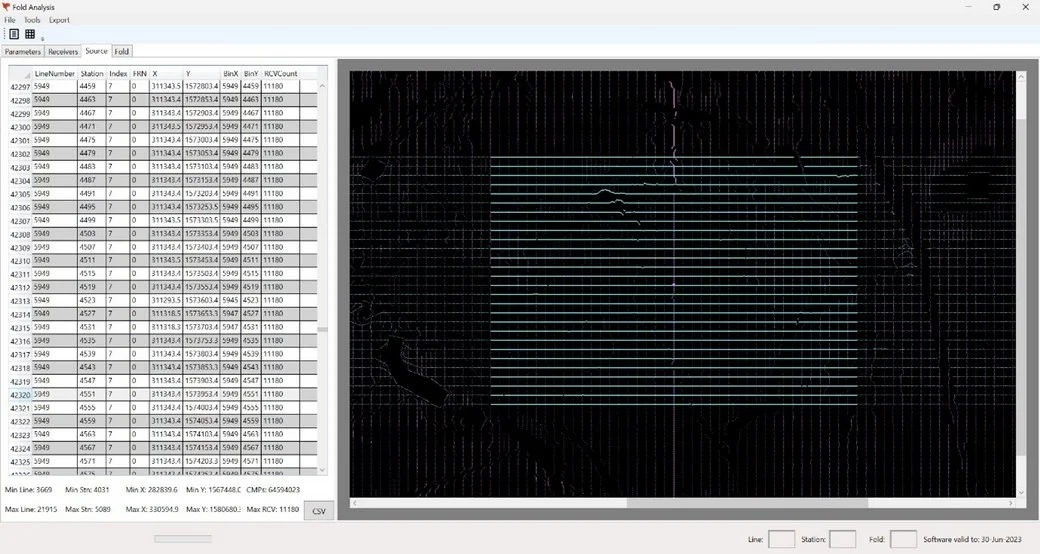
SOURCE GATHER TAB
All source points are listed here with their index, X & Y coordinates, and Bin coordinates.
If an X file is included, the receiver count for each source point is also shown.
All receiver and source points are shown graphically to the right. The image can be zoomed in and out using the mouse wheel, and by zooming from different mouse positions, key areas can be focussed.
The gathers for a particular source point can be shown as highlighted (in cyan) by either selecting the desired source point from the table on the left, or by clicking on its position in the plot on the right. The selected source point, and its containing line, are highlighted in magenta. See below.
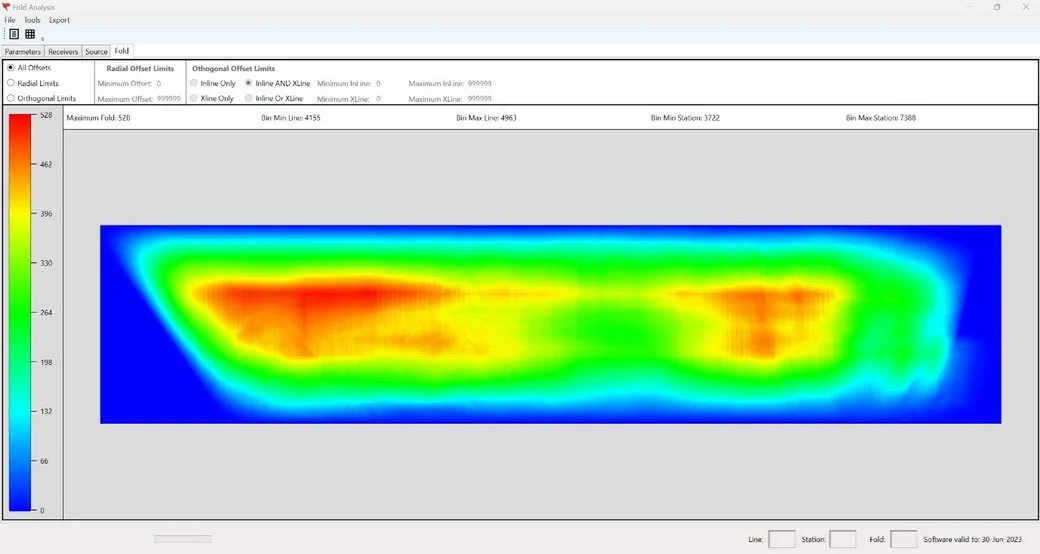
FOLD DISPLAY TAB
After clicking the fold calculation button, the fold distribution plot will be displayed. Fold will be displayed from 0 (blue) through to the maximum calculated value (red). The scale will be displayed on the left.
If there is no cross reference file available (for instance with nodes), the maximum offsets can be stipulated to limit the number of receivers to be process with each source point. These can be specified either as orthogonal or radial values. If specified as orthogonal, the offsets can be restricted individually between inline and/or crossline bins.
The image can then be exported to a file.